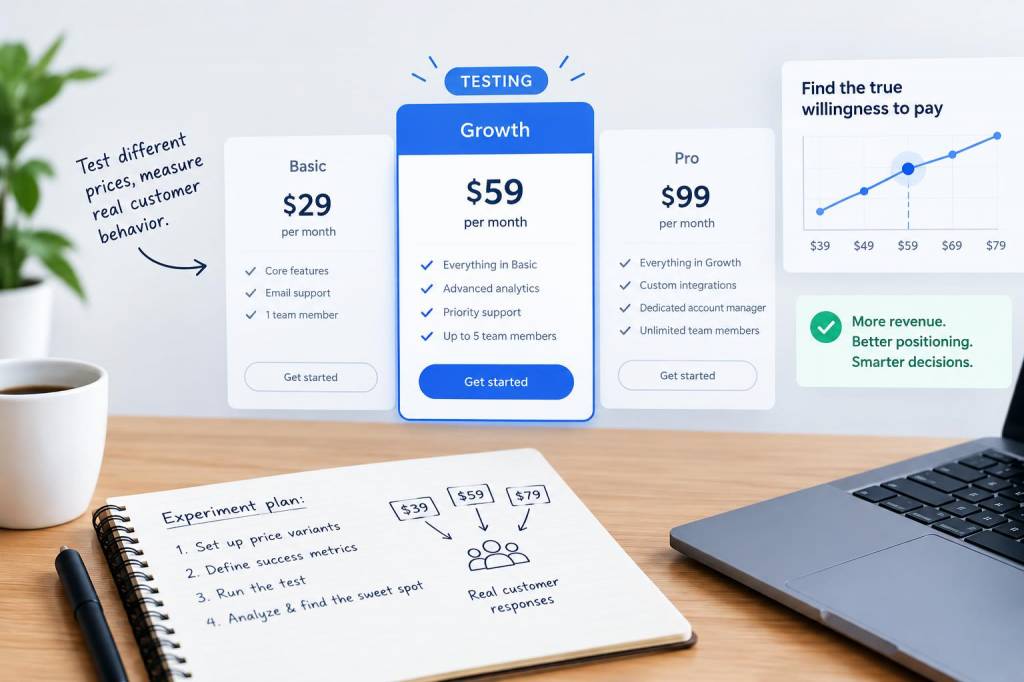
Pricing is one of those topics that sounds simple until you actually try to change it. For mid-market offerings—where buyers are sophisticated, procurement processes matter, and seat/license or usage tiers create complex value equations—bad pricing experiments can mislead you and cost real revenue. I design pricing experiments with three goals in mind: learn fast, avoid long-term distortion, and get statistically meaningful results that reflect true willingness to pay (WTP). Here’s the experiment playbook I use when validating a mid-market tier.
Start with a clear hypothesis and the metric that matters
Every pricing experiment should begin with a single hypothesis. Ambiguity kills learning. Examples of good hypotheses for a mid-market tier:
“Raising the mid-market tier by 15% will not decrease conversion from trial to paid by more than 10%.”“Introducing a value-add bundle (premium support + onboarding) at +25% will increase ARR per customer by 18%.”“Splitting the mid-market tier into two price points will increase average contract value (ACV) without increasing churn.”Then pick one primary metric tied to revenue or acquisition that directly tests that hypothesis. Common primary metrics:
Conversion rate from demo/trial to paidAverage contract value (ACV) or annual recurring revenue (ARR)Win rate on qualified opportunitiesChurn or retention rate at 90/180 daysChoose the right experiment type
Not all pricing experiments are A/B tests on a public page. For mid-market tiers I typically use a mix depending on GTM model:
Public pricing page A/B test — good if your product is self-serve or you get many inbound evaluators. This reveals WTP for price-sensitive buyers browsing the site.Sales-assisted A/B — route inbound MQLs or SDR-qualified leads to different offer frameworks when they hit a sales process. Sales can present Option A or Option B and you measure win rates and ACV. This is essential for mid-market where demos and negotiations happen.Controlled pilots / beta cohorts — pick a segment of customers and expose them to a new mid-market price or bundle for a defined period (e.g., next renewal). Track churn, NPS, and expansion rate.Survey-based WTP (Gabor-Granger / Van Westendorp) — use targeted surveys on existing customers and qualified prospects to triangulate acceptable price ranges. These aren’t definitive but help narrow candidate prices to test live.I often combine approaches: run a Van Westendorp survey to generate price candidates, then A/B test the most promising levels through the sales process.
Designing the A/B or multivariate experiment
When you run a live experiment, you must control allocation, sample size, and time window.
Randomization — ensure users/leads are randomly assigned to conditions. For sales-assisted tests, randomize at lead or account level to avoid cross-contamination.Sample size — mid-market deals have higher ACV but lower volume. Use power calculations. If you expect a 10% change in conversion, be realistic about the number of leads needed to detect it. If you can’t reach statistical power, consider lengthening the test or using a larger uplift to make detection possible.Time window — run experiments for a full sales cycle when possible. If your average sales cycle is 90 days, a 2-week pricing A/B test will tell you nothing about close/win outcomes. For multi-stage processes, track leading indicators (demo-to-proposal conversion) but continue measuring ultimate outcomes.Segmentation — mid-market is not homogeneous. Segment by ARR/employee count/industry/use-case and analyze results by cohort. A price that works for high-volume service teams might fail for small finance teams and vice versa.Mitigate common risks
Pricing experiments can have negative long-term impacts if poorly executed. Here are guardrails I always put in place:
Protect pricing integrity — if you present different prices, prevent sales reps from freely offering the lower price to everyone. Use promo codes, time-limited offers or require manager approval for exceptions.Prevent cannibalization — if testing a new mid-market tier, make sure your enterprise and SMB tiers are insulated. Track migration between tiers and ensure base customers aren’t downgraded to “win” the test.Transparency to sales — equip SDRs/AEs with scripts and FAQ for both price variations. Friction or confusion skews results.Legal & procurement implications — mid-market buyers often involve procurement teams. Sudden price changes during negotiation can sour relationships. Communicate any pilots or new price structures to key accounts ahead of time.What to measure beyond the primary metric
There’s a few secondary metrics that reveal whether a price change is sustainable:
Lead velocity — did the price move change inbound interest or demo bookings?Time to close — higher prices might increase contract negotiation time; that has cost implications.Upsell/expansion rate — does the new tier increase future expansion or reduce it?Churn at 90/180 days — immediate acceptance is worthless if retention drops.Support load — higher-tier pricing often increases expectations for support and onboarding. Monitor tickets and SLA breaches.Analyzing results and estimating true WTP
Look for consistency across metrics and cohorts. I trust results that show:
Aligned direction in primary and secondary metrics (e.g., higher ACV and neutral or improved retention)Statistical significance or clear practical significance if sample size is smallConsistency across segments or a clear pattern that explains differencesTo estimate WTP, don’t rely only on conversion rate. Use a blended approach:
Survey-derived price ranges (Van Westendorp) to validate the domainObserved conversion at each price level to model price elasticityRevenue per visitor/lead calculations to estimate optimal price by maximizing expected revenue (price × conversion rate)Practical example: mid-market tier split test matrix
| Variant | Price | Offer | Primary metric |
|---|
| Control | $1,200/mo | Standard mid-market features | Trial→Paid conversion |
| Variant A | $1,380/mo (+15%) | Same features | Trial→Paid conversion, ACV |
| Variant B | $1,500/mo (+25%) | +Dedicated onboarding (1 session) | ACV, 90-day retention |
I would randomize new trial signups into these buckets, run for one full sales cycle, and analyze both conversion and early retention. If Variant A shows small conversion dip but higher ACV and neutral retention, that validates a price increase. If Variant B sells less but has much lower churn, consider making onboarding an optional add-on instead of bundling.
Communicating outcomes and next steps
When the experiment ends, package results into three things for the exec team:
A clear recommendation (implement, iterate, or reject)Supporting data: sample sizes, confidence intervals, cohort breakdownsAn implementation plan with guardrails — rollout timeline, grandfathering rules, sales training, and monitoring KPIs for the first 3–6 monthsIf you decide to roll out a higher mid-market price, I recommend a phased approach: grandfather existing customers for 12 months, give predictable notice for upcoming renewals, and create a premium onboarding/support upsell to capture buyers who value white-glove onboarding.
Pricing is never “set and forget,” especially for mid-market tiers where product maturity, competition and buyer expectations evolve quickly. Treat pricing experiments as continuous learning loops: hypothesize, test, measure, and institutionalize what works while protecting your brand and customer trust. If you want, I can draft an experiment plan tailored to your funnel and ARR targets — tell me your average deal size and sales cycle and I’ll sketch the sample-size math and variant suggestions.